Annotated spread of COVID-19 through race and ethnicity.
COVID-19 is not static. We should be able to see how the pandemic changes over time.
San Francisco’s dashboard presents the race and ethnicity break down of COVID-19 cases for the entirety of the pandemic. That statistic is relevant once COVID-19 is over and you want to write a history book about it. The bar chart statistic pictured clumping together cases from March with cases from August is not relevant for what is happening now. It does not give us a sense of the current course of the pandemic. Thankfully San Francisco’s open dataset contains time series information so I can produce plots of how race and ethnicity vary over time. Here’s what I see in the data.
June spike: first in the white population, then in other communities.
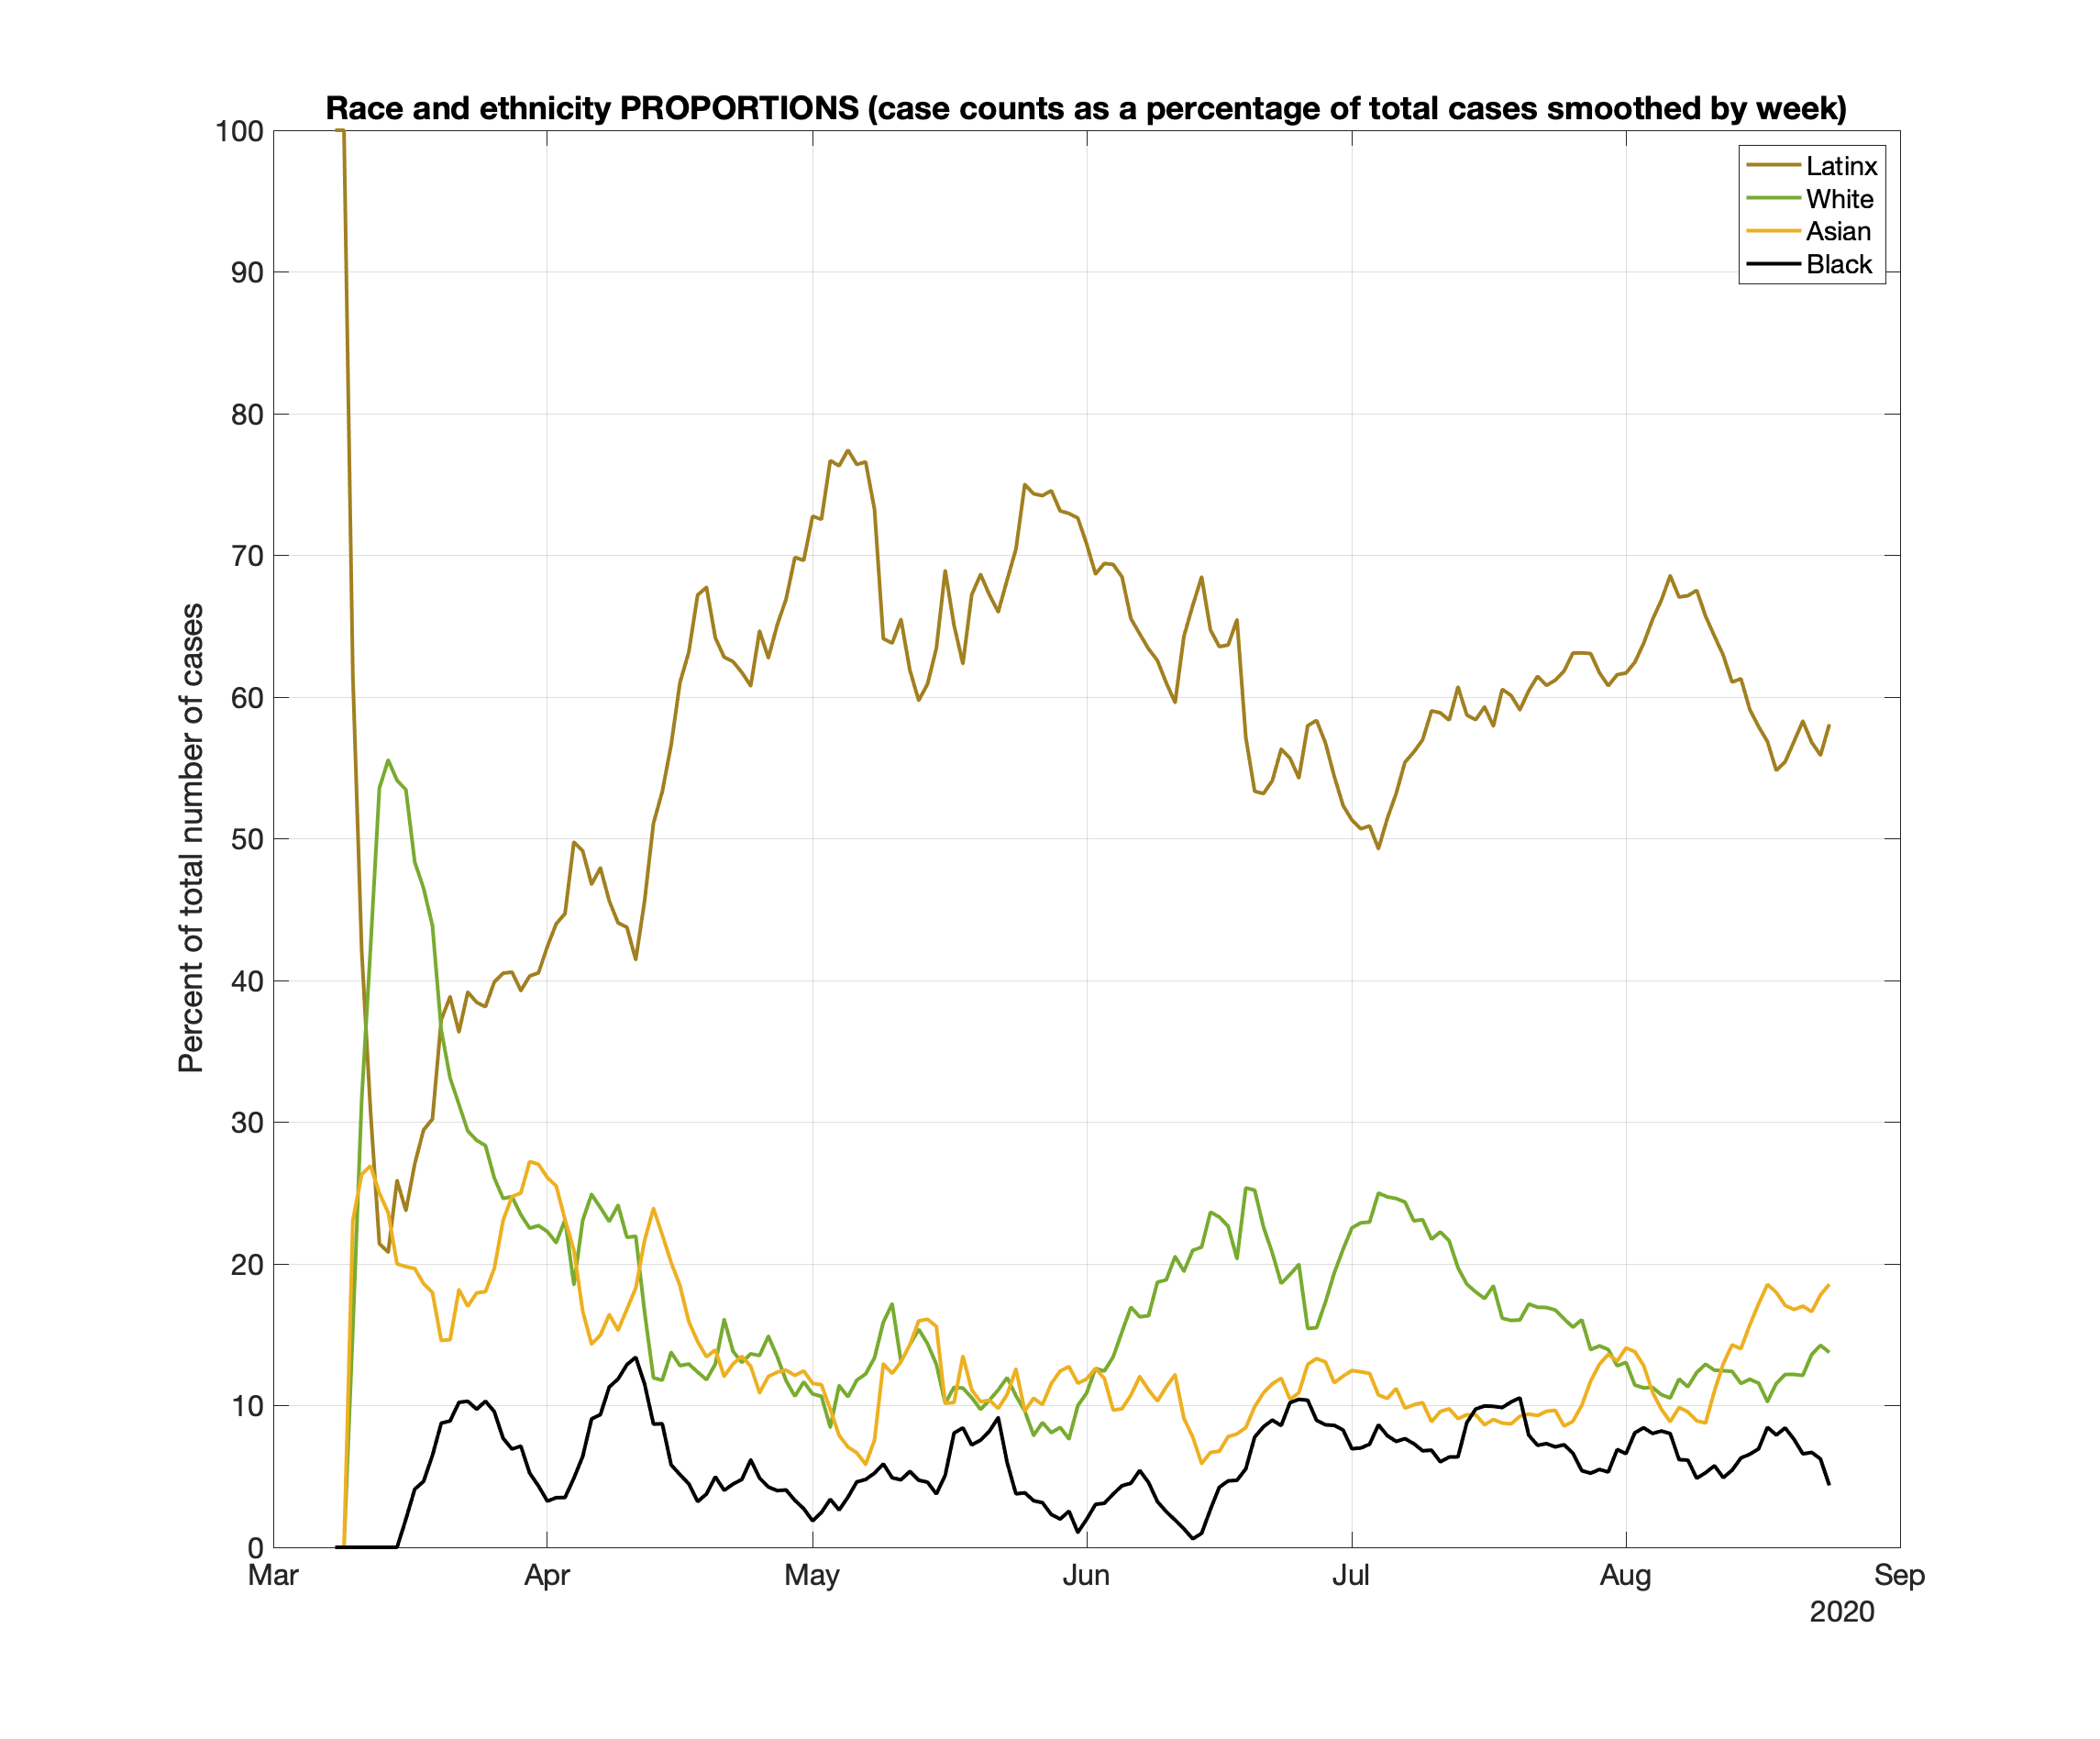
The generic rise in cases that San Francisco experienced in mid-June becomes more nuanced when you look at that spike through the lens of race and ethnicity. Look at the figure at the top of this post and note that cases started spiking in the white community back in the end of May. This spike in the white community was at first masked by a consistent drop in cases in the LatinX community. Towards the end of June, cases start taking off among all races and ethnicities.
I put this plot on a logarithmic y-axis so that you can see just how dramatic the spike was in the white population. The case numbers themselves were small but placed on a logarithmic axis you can see that the number of cases is doubling every week which is a very rapid rise..
The drop behaves similarly to the climb. Cases start dropping first in the white population around mid-July, but it takes until mid-August before the LatinX community starts to see a drop in cases.
Perhaps cases of COVID-19 spread from the white population of SF to the other communities? If this dynamic is a real effect, a big if, then this might play itself out again in the future. We can look for a rise in COVID-19 cases in the white community as a leading indicator, or warning sign, to other communities that a significant surge could be coming. This is all hypothetical at the moment.
As the LatinX community goes so goes San Francisco.
The curve for the total number of cases in San Francisco tracks very closely with the number of cases of COVID-19 in the LatinX population. If we want to slow, stop, or have any effect on the pandemic in San Francisco, we need to be out assisting the LatinX community. If you want to see your kids back in school, then help get people in the LatinX community tested. If you want to meet with friends indoors this fall and winter, then help LatinX people quarantine and isolate to stop the spread of new cases. San Francisco will not get to a better place until we can get the LatinX community to a better place. Personally, I am looking to see how I can help the Latino Task Force which is doing great work in the southeast part of San Francisco.
An average over the entire pandemic belies the extreme trauma of particular spikes.
I and others have known and written about how hard the LatinX community is being hit by COVID-19. For these posts we have used the total number of cases for the entire pandemic. But there were times in this pandemic during which this community was suffering even more. The plot above first averages the race and ethnicity data over a 3 week period to smooth it. Then using those numbers and the white population as a reference baseline I ask the question how much more likely in a given 3 week window was a person of a particular race or ethnic group likely to get infected with COVID-19 than a white person. For the LatinX community these ratios are truly huge. Since mid-April a LatinX individual has always been at least 7 times more likely to get COVID-19 than a white individual. And the ratio became ginormous in late May in which a LatinX individual was 20 times more likely to get COVID-19 than a white individual. Right now this ratio remains quite high at 13 times more likely.
While the ratios for Blacks are not off the chart in the same way as for the LatinX population, the ratios are still quite high. Throughout this pandemic Blacks have always been more likely to get COVID-19. Right now, Blacks are currently 3 times more likely to get COVID-19 than whites.
Help me solve a mystery. Asian cases are spiking now (relatively speaking). Why?
In the current dynamics of this pandemic in San Francisco, the number of cases in the Asian community is spiking relative to other races and ethnicities. Other ethnic groups have seen recent drops in their case numbers. We aren’t seeing that same drop in the Asian community. Cases in the Asian community are staying relatively flat when they should be dropping. Why? Does anyone have any theories? Can anyone do some digging to figure out why?


